
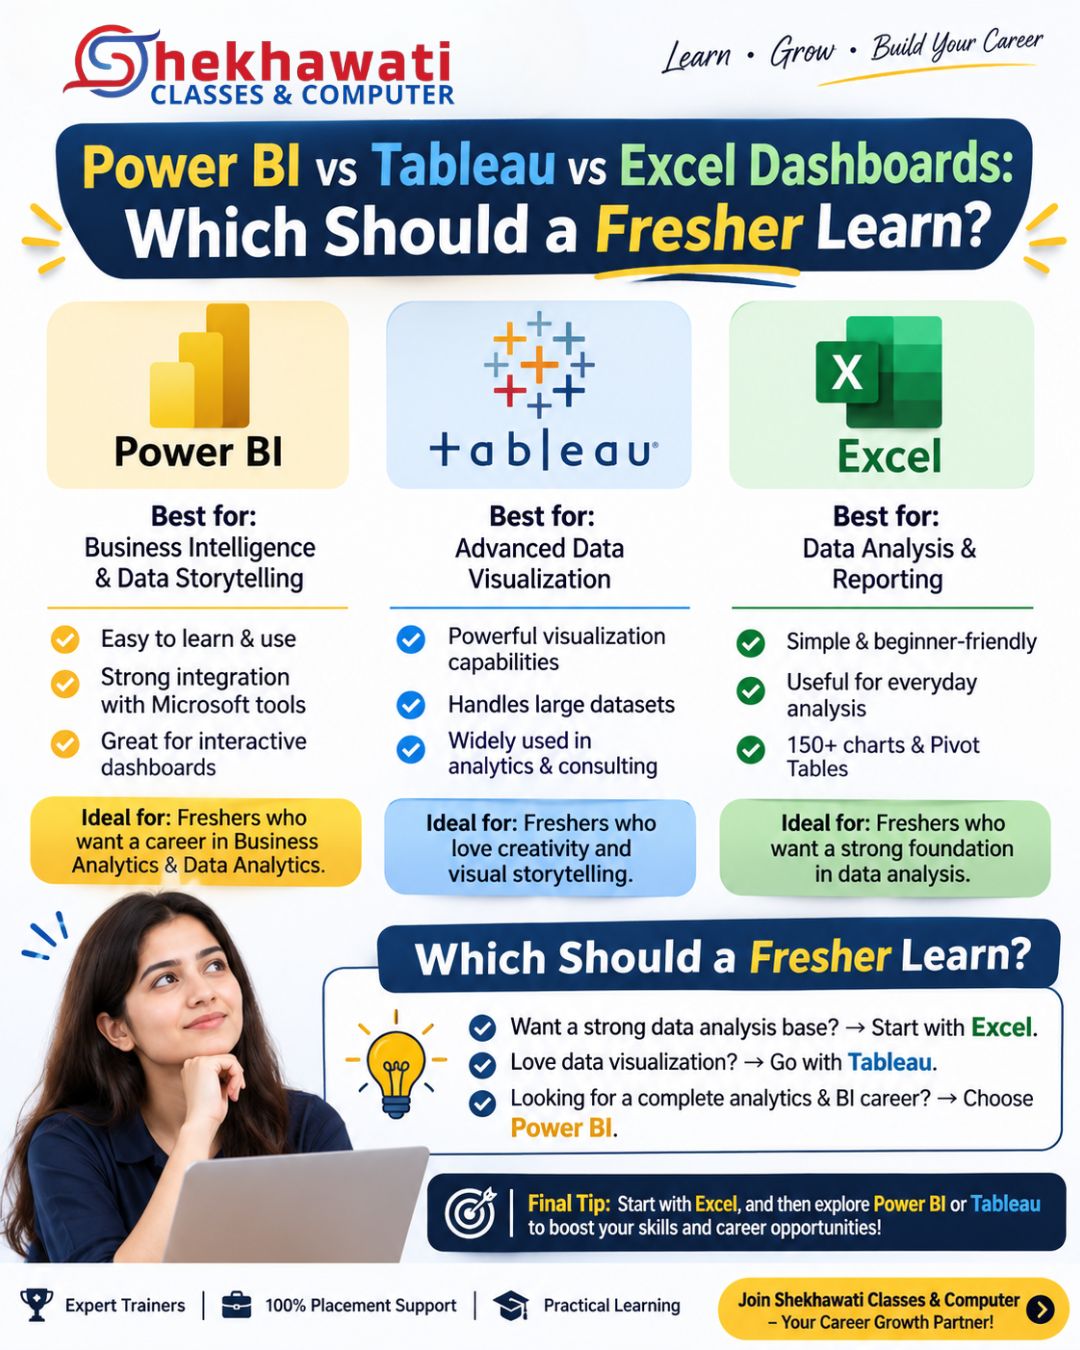
Power BI vs Tableau vs Excel Dashboards: Which Should a Fresher Learn?
Confused between Power BI, Tableau and Excel dashboards? Here’s an honest, beginner-friendly comparison to help you pick the right tool for your first data analyst job in Jaipur.
Let me guess how you got here.
You typed “data analyst course” into Google, watched a few YouTube videos, and now you have three tabs open: Power BI, Tableau, and Excel. Every video says its tool is the best. Your cousin says “just learn Excel.” A LinkedIn post says Tableau is dead. Another one says Power BI is taking over.
So which one should you actually spend your time on?
Short answer: start with Excel, then add Power BI. Tableau comes later, only if a job asks for it. The rest of this post explains why, so you can decide for yourself.
First, what do these tools actually do?
All three do the same basic job. They take messy numbers (sales, attendance, website visits, expenses) and turn them into something a normal person can understand in ten seconds. A chart, a summary, a dashboard your manager can open on Monday morning and say, “Okay, now I get it.”
The difference is how they do it, how much they cost, and who uses them.
Excel dashboards: where almost everyone starts
Excel is the tool you’ve probably already touched, even if only to make a marks list. It’s on nearly every office computer in India, from a small trading firm in Johari Bazaar to a big company in Mahindra World City.
What’s good about it
- You likely already know the basics, so the learning curve is gentle.
- Pivot tables, formulas like XLOOKUP and SUMIFS, and charts cover a huge amount of real office work.
- Small and mid-sized businesses run on Excel. Many of them will never switch.
- It teaches you how to think about data: cleaning it, sorting it, spotting what looks wrong.
What’s not so good
- Once your file crosses a few hundred thousand rows, it gets slow and sometimes crashes.
- Dashboards in Excel can look a bit plain unless you put real effort into design.
- Sharing and refreshing data automatically is clumsy compared to Power BI.
If you can’t confidently build a pivot table and write a decent lookup formula, you aren’t ready for Power BI or Tableau yet. Skipping Excel is the most common mistake we see freshers make.
Power BI: the one most Indian employers ask for
Power BI is Microsoft’s tool, and it connects smoothly with Excel, which is exactly why it has spread so quickly. If you look at fresher data analyst openings, you’ll see “Power BI” mentioned again and again, often right next to “Excel” and “SQL.”
What’s good about it
- Power BI Desktop is free to download, so you can practice without paying anything.
- It feels familiar if you know Excel. Even the formula language (DAX) will look a little like Excel formulas.
- It handles much bigger data than Excel and refreshes automatically.
- Companies already using Microsoft products find it easy to adopt, which is a lot of companies.
What’s not so good
- Power BI Desktop runs on Windows only. Mac users will need a workaround.
- DAX can be confusing at first. Almost every beginner gets stuck on it for a week or two. That’s normal.
- Sharing dashboards inside a company usually needs a paid license, but that’s the company’s problem, not yours.
Tableau: powerful, beautiful, but a bit more niche
Tableau is famous for gorgeous, flexible visuals. If someone shows you a dashboard that looks like it belongs in a magazine, there’s a good chance it was built in Tableau.
What’s good about it
- Visualization is its strongest point. You can build very polished charts quickly.
- Popular in larger companies, consulting firms and some global teams.
- Tableau Public is free, so you can build a portfolio online.
What’s not so good
- The full desktop version is expensive compared to Power BI.
- Fewer entry-level openings ask for it, especially outside the big metros.
- Learning it before you’ve got the basics down can feel like learning to drive in a Formula 1 car.
None of this means Tableau is bad. It’s excellent. It’s just not the best first step for most freshers in Jaipur.
A simple side-by-side
| Feature | Excel | Power BI | Tableau |
|---|---|---|---|
| Learning difficulty | Easy | Medium | Medium to hard |
| Cost to practice | Usually already have it | Free (Desktop) | Free (Public) / paid (Desktop) |
| Best for | Everyday analysis, small businesses | Business dashboards, most fresher jobs | Advanced visuals, bigger firms |
| Handles huge data | Struggles | Good | Good |
| Fresher job demand in India | Very high | Very high | Moderate |
So what should YOU learn?
Here’s how I’d think about it, depending on where you are.
If you’re a complete beginner, or a commerce or arts student: Start with Excel. Spend a month or two getting really comfortable. Then move to Power BI.
If you’re aiming for a specific company or an international role: Check a few job listings first. If they ask for Tableau, learn Tableau. Don’t guess.
If you want a data analyst job in a reasonable time: The most common path is Excel, then SQL, then Power BI, then a bit of Python. Tableau can wait.
One thing nobody tells you
The tool matters less than you think.
A hiring manager isn’t impressed because you clicked the right buttons in Power BI. They want to know that you can look at a pile of numbers and say, “Sales dropped in March because two of our top customers stopped ordering, and here’s what I’d do about it.”
That skill comes from practicing on real data and explaining your findings out loud. Tools are just the way you show it. If you can think clearly, switching from Power BI to Tableau takes a few weeks, not a few years.
So pick one, build real projects, and put them in a portfolio. Three good dashboards will do more for you than five certificates.
Where to learn this in Jaipur
If you’d like guided practice instead of figuring it all out alone, our Power BI course and Data Analyst course at Shekhawati Classes & Computer (Jhotwara and Vaishali Nagar) cover Excel, Power BI and hands-on projects step by step. Come visit a class, talk to the trainer, and see whether the teaching style suits you before you decide anything. Good learning is easier when you can ask questions in person.
Power BI course Data Analyst course Advanced Excel course
Quick recap
- Excel is your foundation. Don’t skip it.
- Power BI is the best next step for most freshers in India.
- Tableau is great, but learn it when a job actually asks for it.
- Projects and clear thinking beat any single tool.
Got a question about which path fits you? Drop it in the comments or call us, and we’ll help you work it out.
Also Explore:-
https://shekhawaticlasses.com/courses/data-analyst-course-in-jaipur
https://shekhawaticlasses.com/courses/power-bi-course-in-jaipur
https://shekhawaticlasses.com/courses/advance-excel-course-in-jaipur